9 explorations · IBGE, CNEFE, Federal Revenue, SINASC, SIM
ミxploring New Cartographic Technologies
Today, through a screen, an individual can interrelate, interact, represent and navigate among millions of data points. Technological advances have drastically expanded our capacity to map territories, networks and flows.
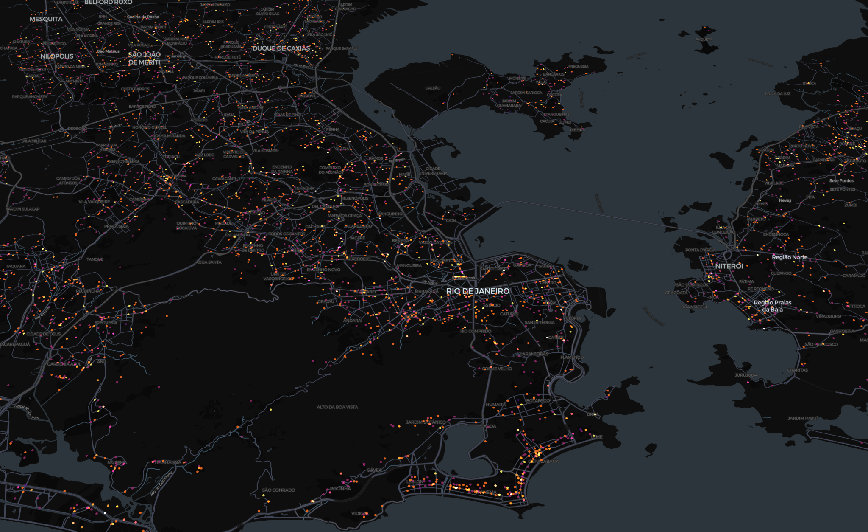
01 · Rio de Janeiro: every dot is a company
It looks like a nighttime aerial photo — but every dot of light is a business establishment registered with Brazil's Federal Revenue. Plotting the location of every active establishment in the National Registry of Legal Entities (CNPJ), the urban fabric draws itself: avenues, commercial centers and peripheries emerge without any base map.
Not an aerial photo: it is the Federal Revenue registry projected onto the territory.
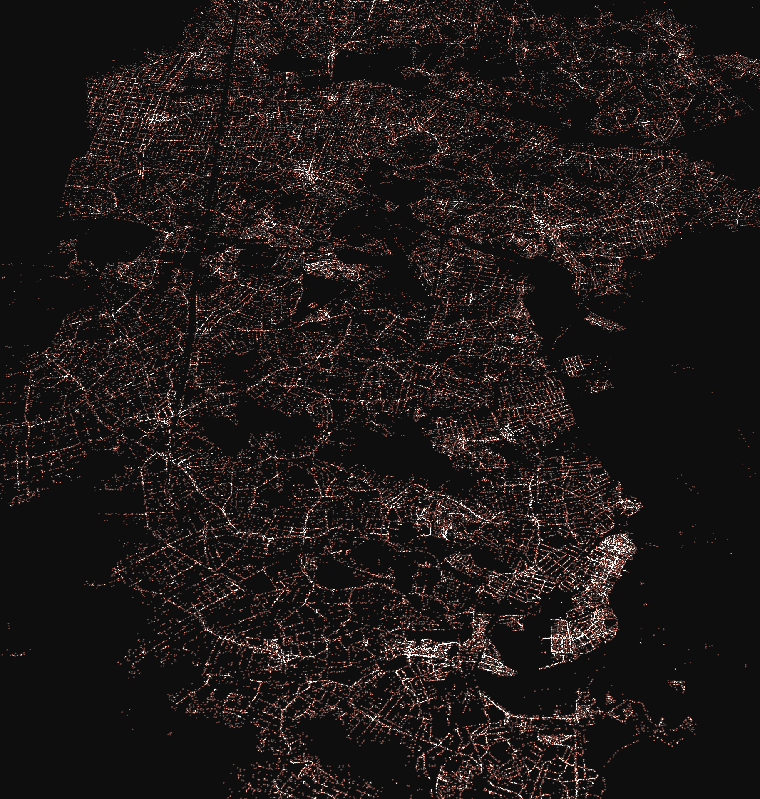
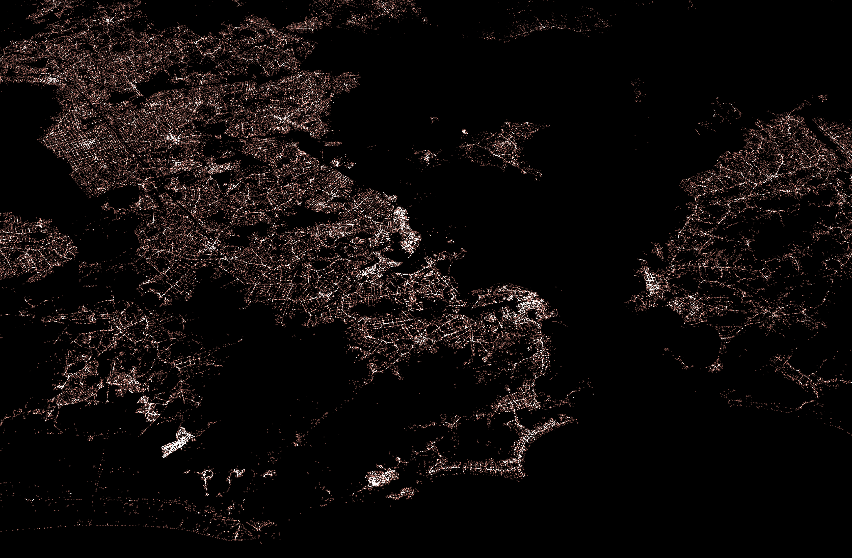
Explore the interactive version at ミ.xyz/dataviz/rio/ibge. The same treatment, now with precise address-level geolocation (2022 IBGE Census), is available for all 27 states.
02 · Every church in the country
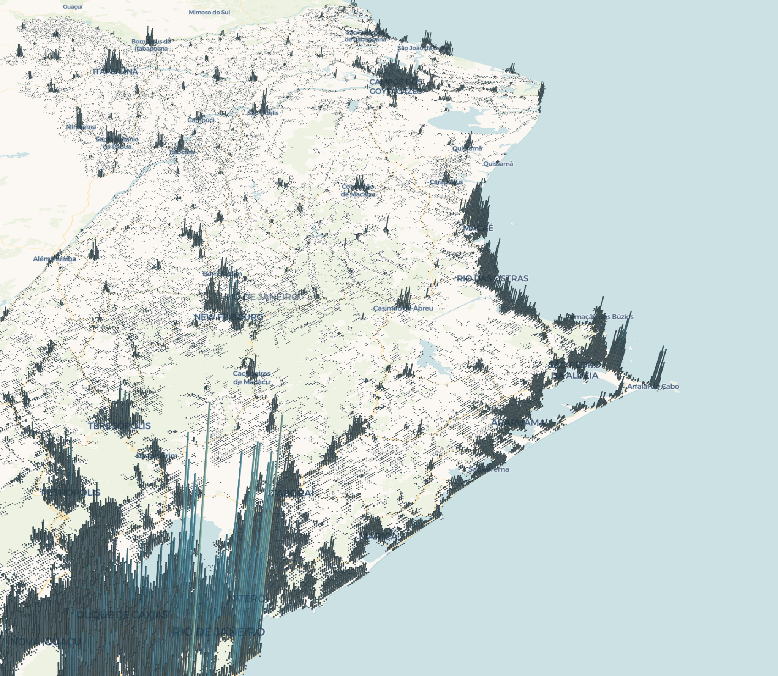
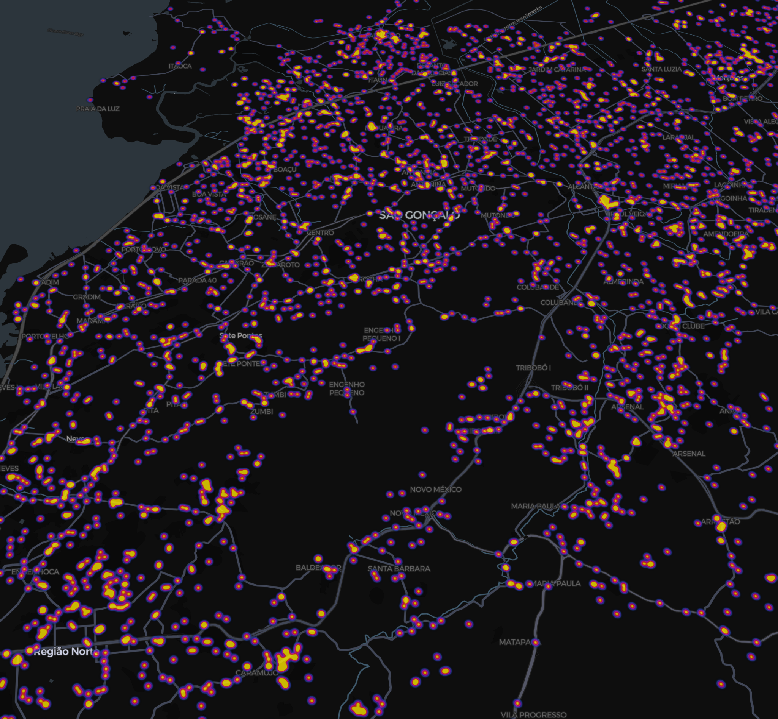
The CNPJ registry records the legal nature of each establishment, which makes it possible to isolate religious organizations and plot them onto the territory. The result is a portrait of the country's religious infrastructure — and of the asymmetries that appear when we compare it with schools, health units and labor unions.
The national map

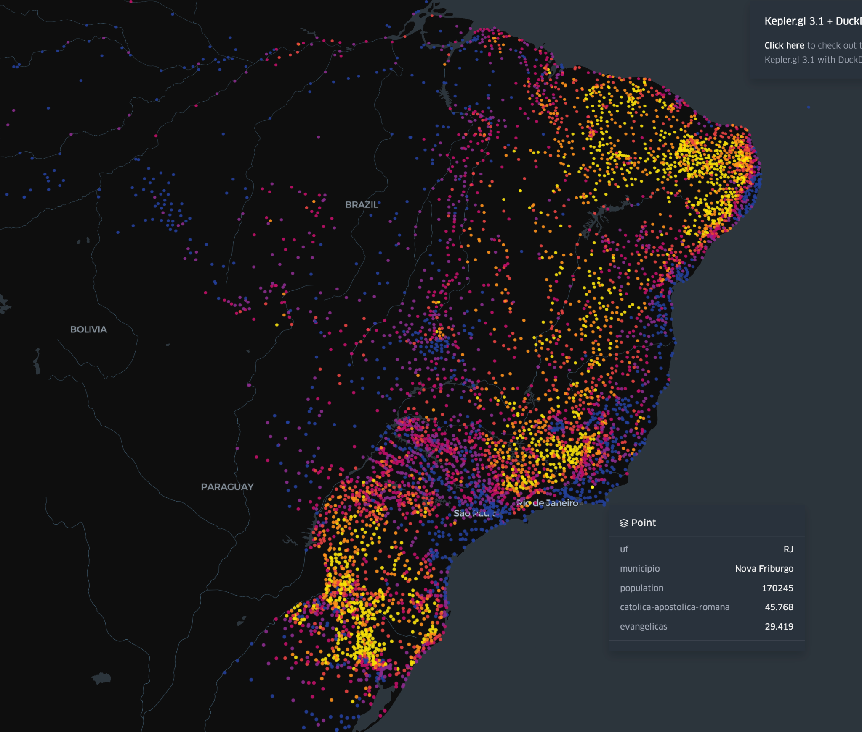
The religious profile of each municipality
Crossing the IBGE Census with municipal locations, the country can be colored by the declared religious profile of its population: the more yellow, the more Catholic the municipality; purple tends to indicate Evangelical predominance.
Explore the interactive version at ミ.xyz/dataviz/religioes.
More churches than health units
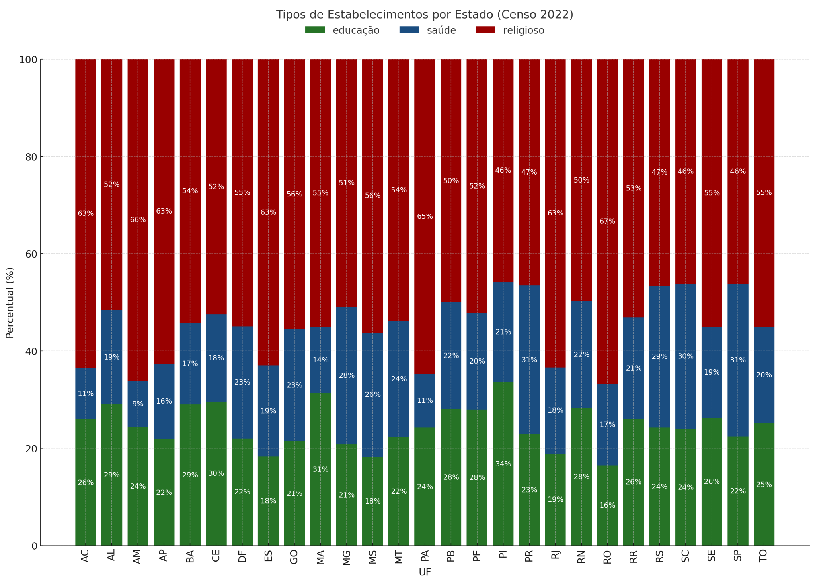
22 of Brazil's 27 states have twice as many religious establishments as health units.
Religious entities overtake labor unions

And the schools?
03 · Births in numbers
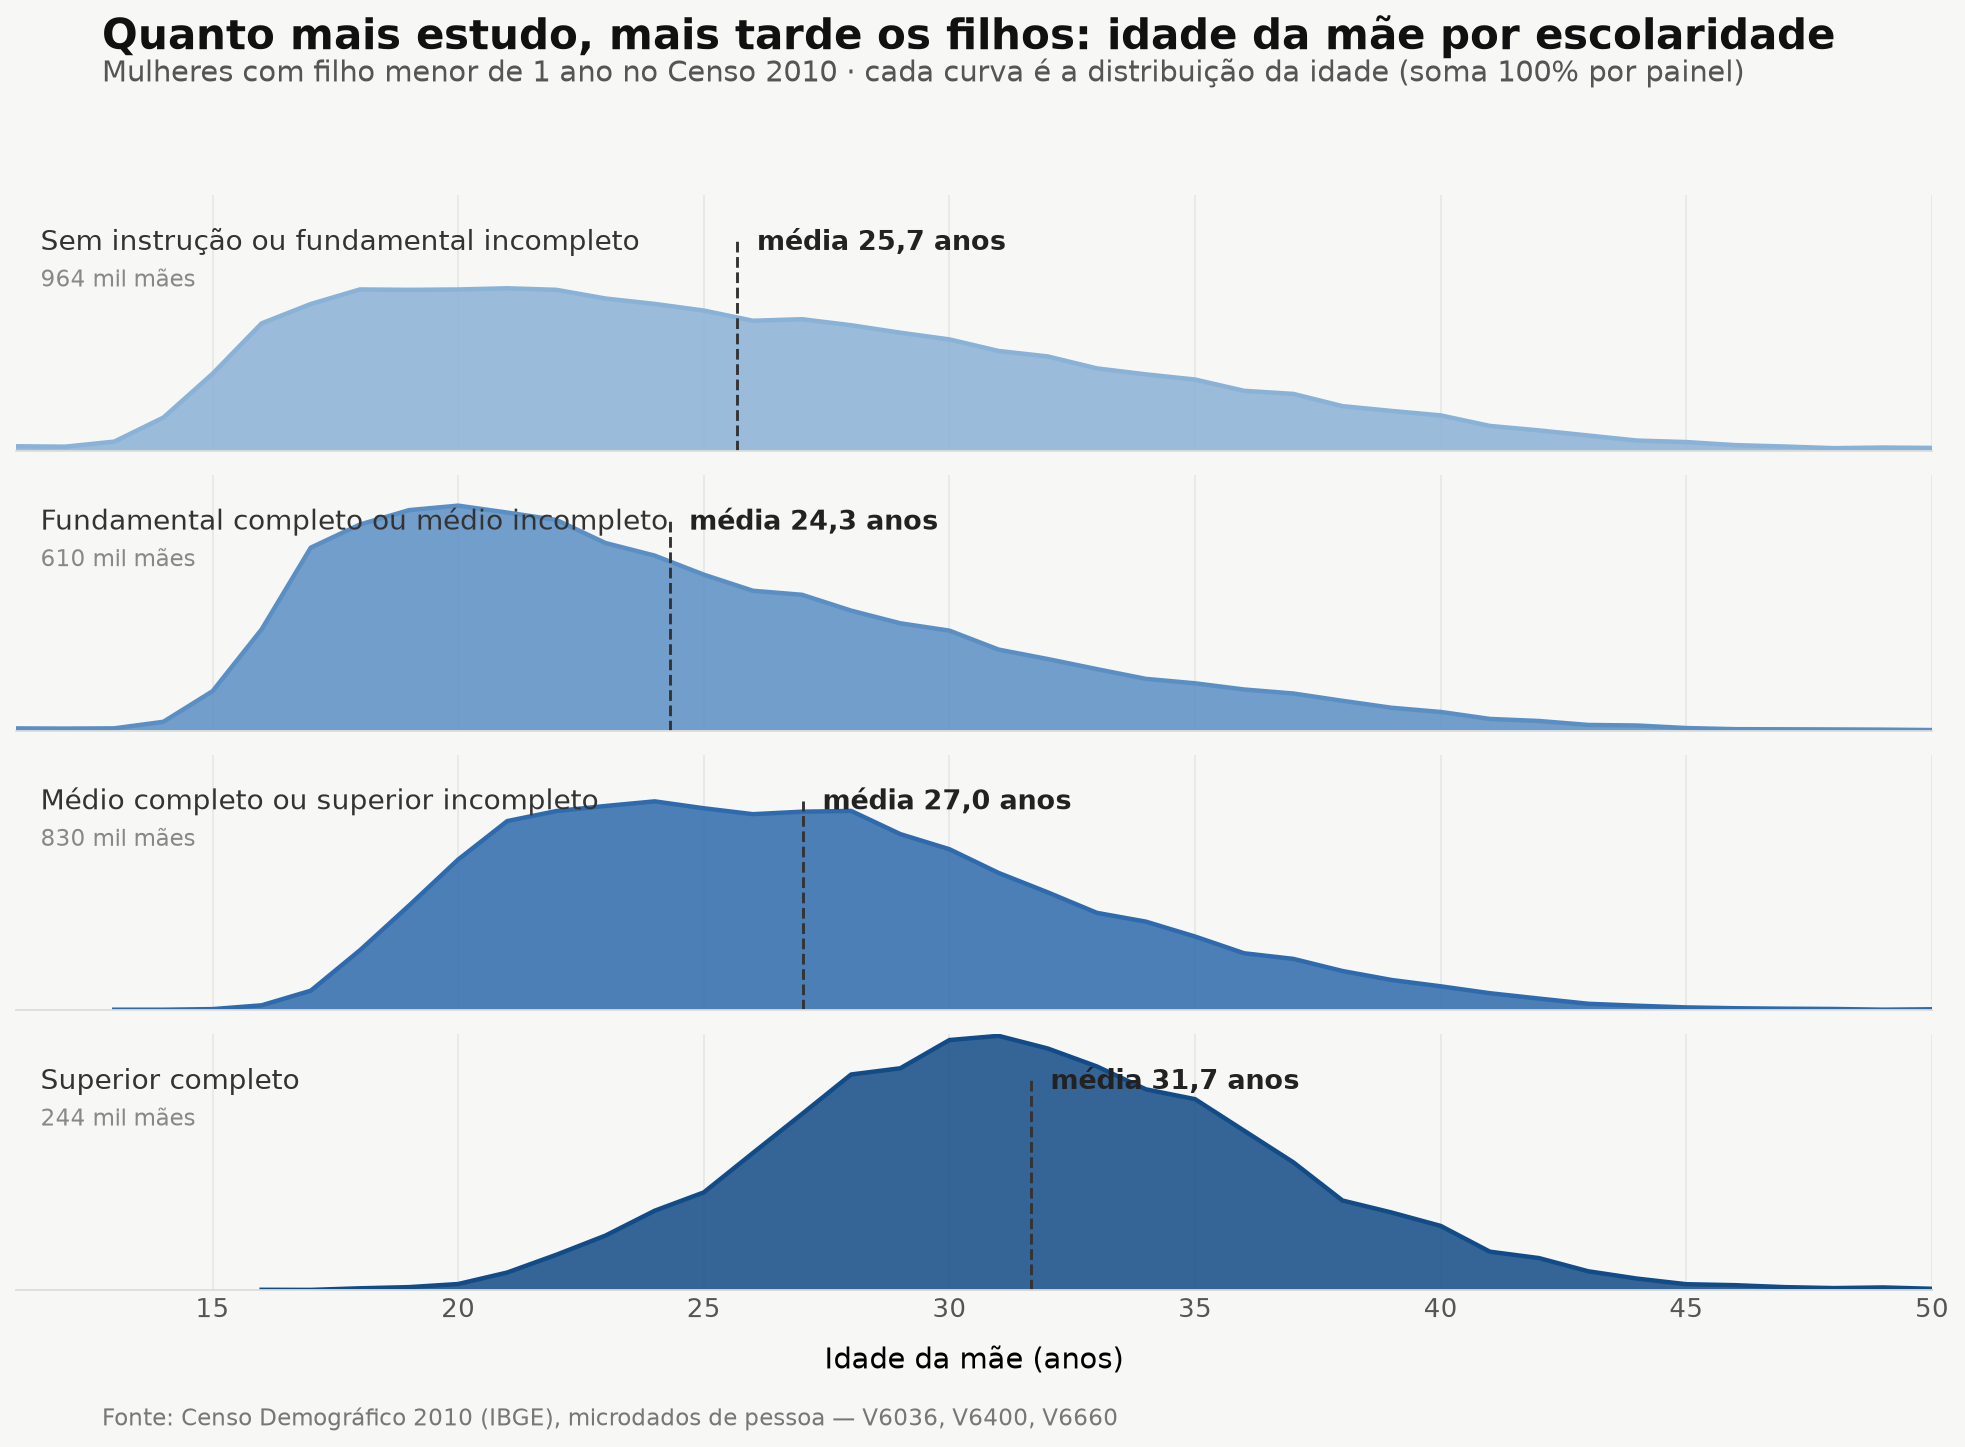
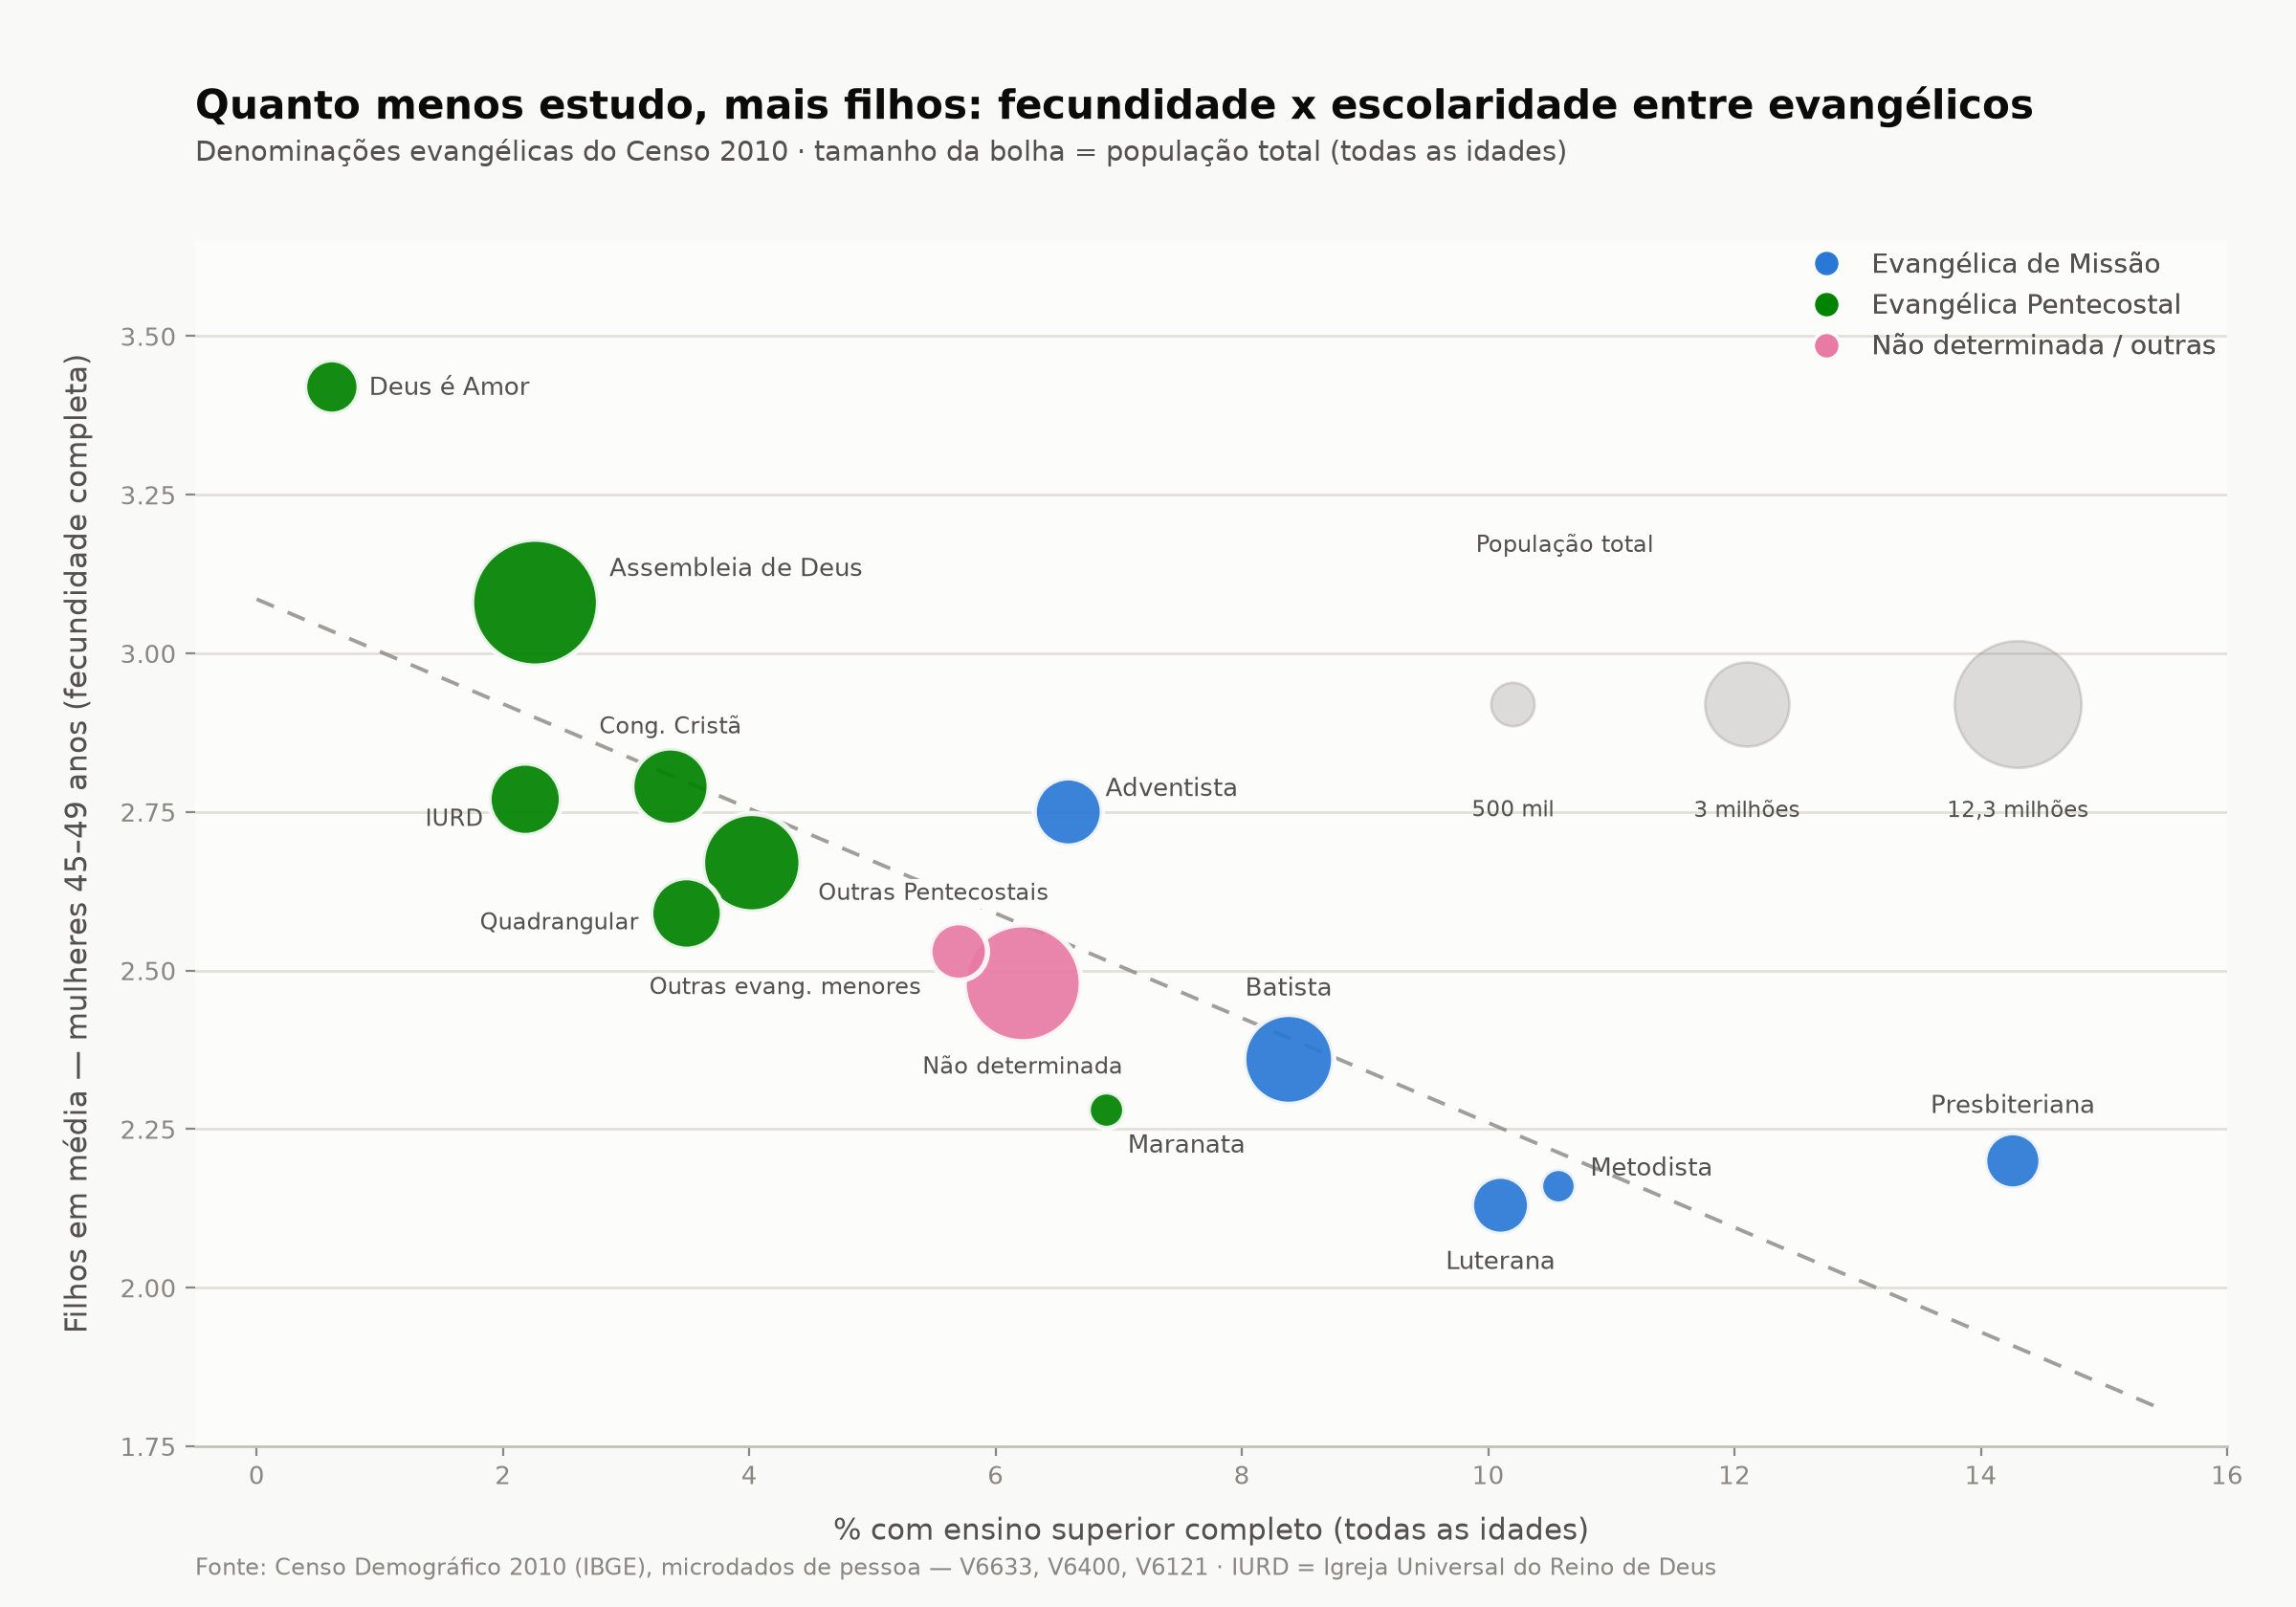
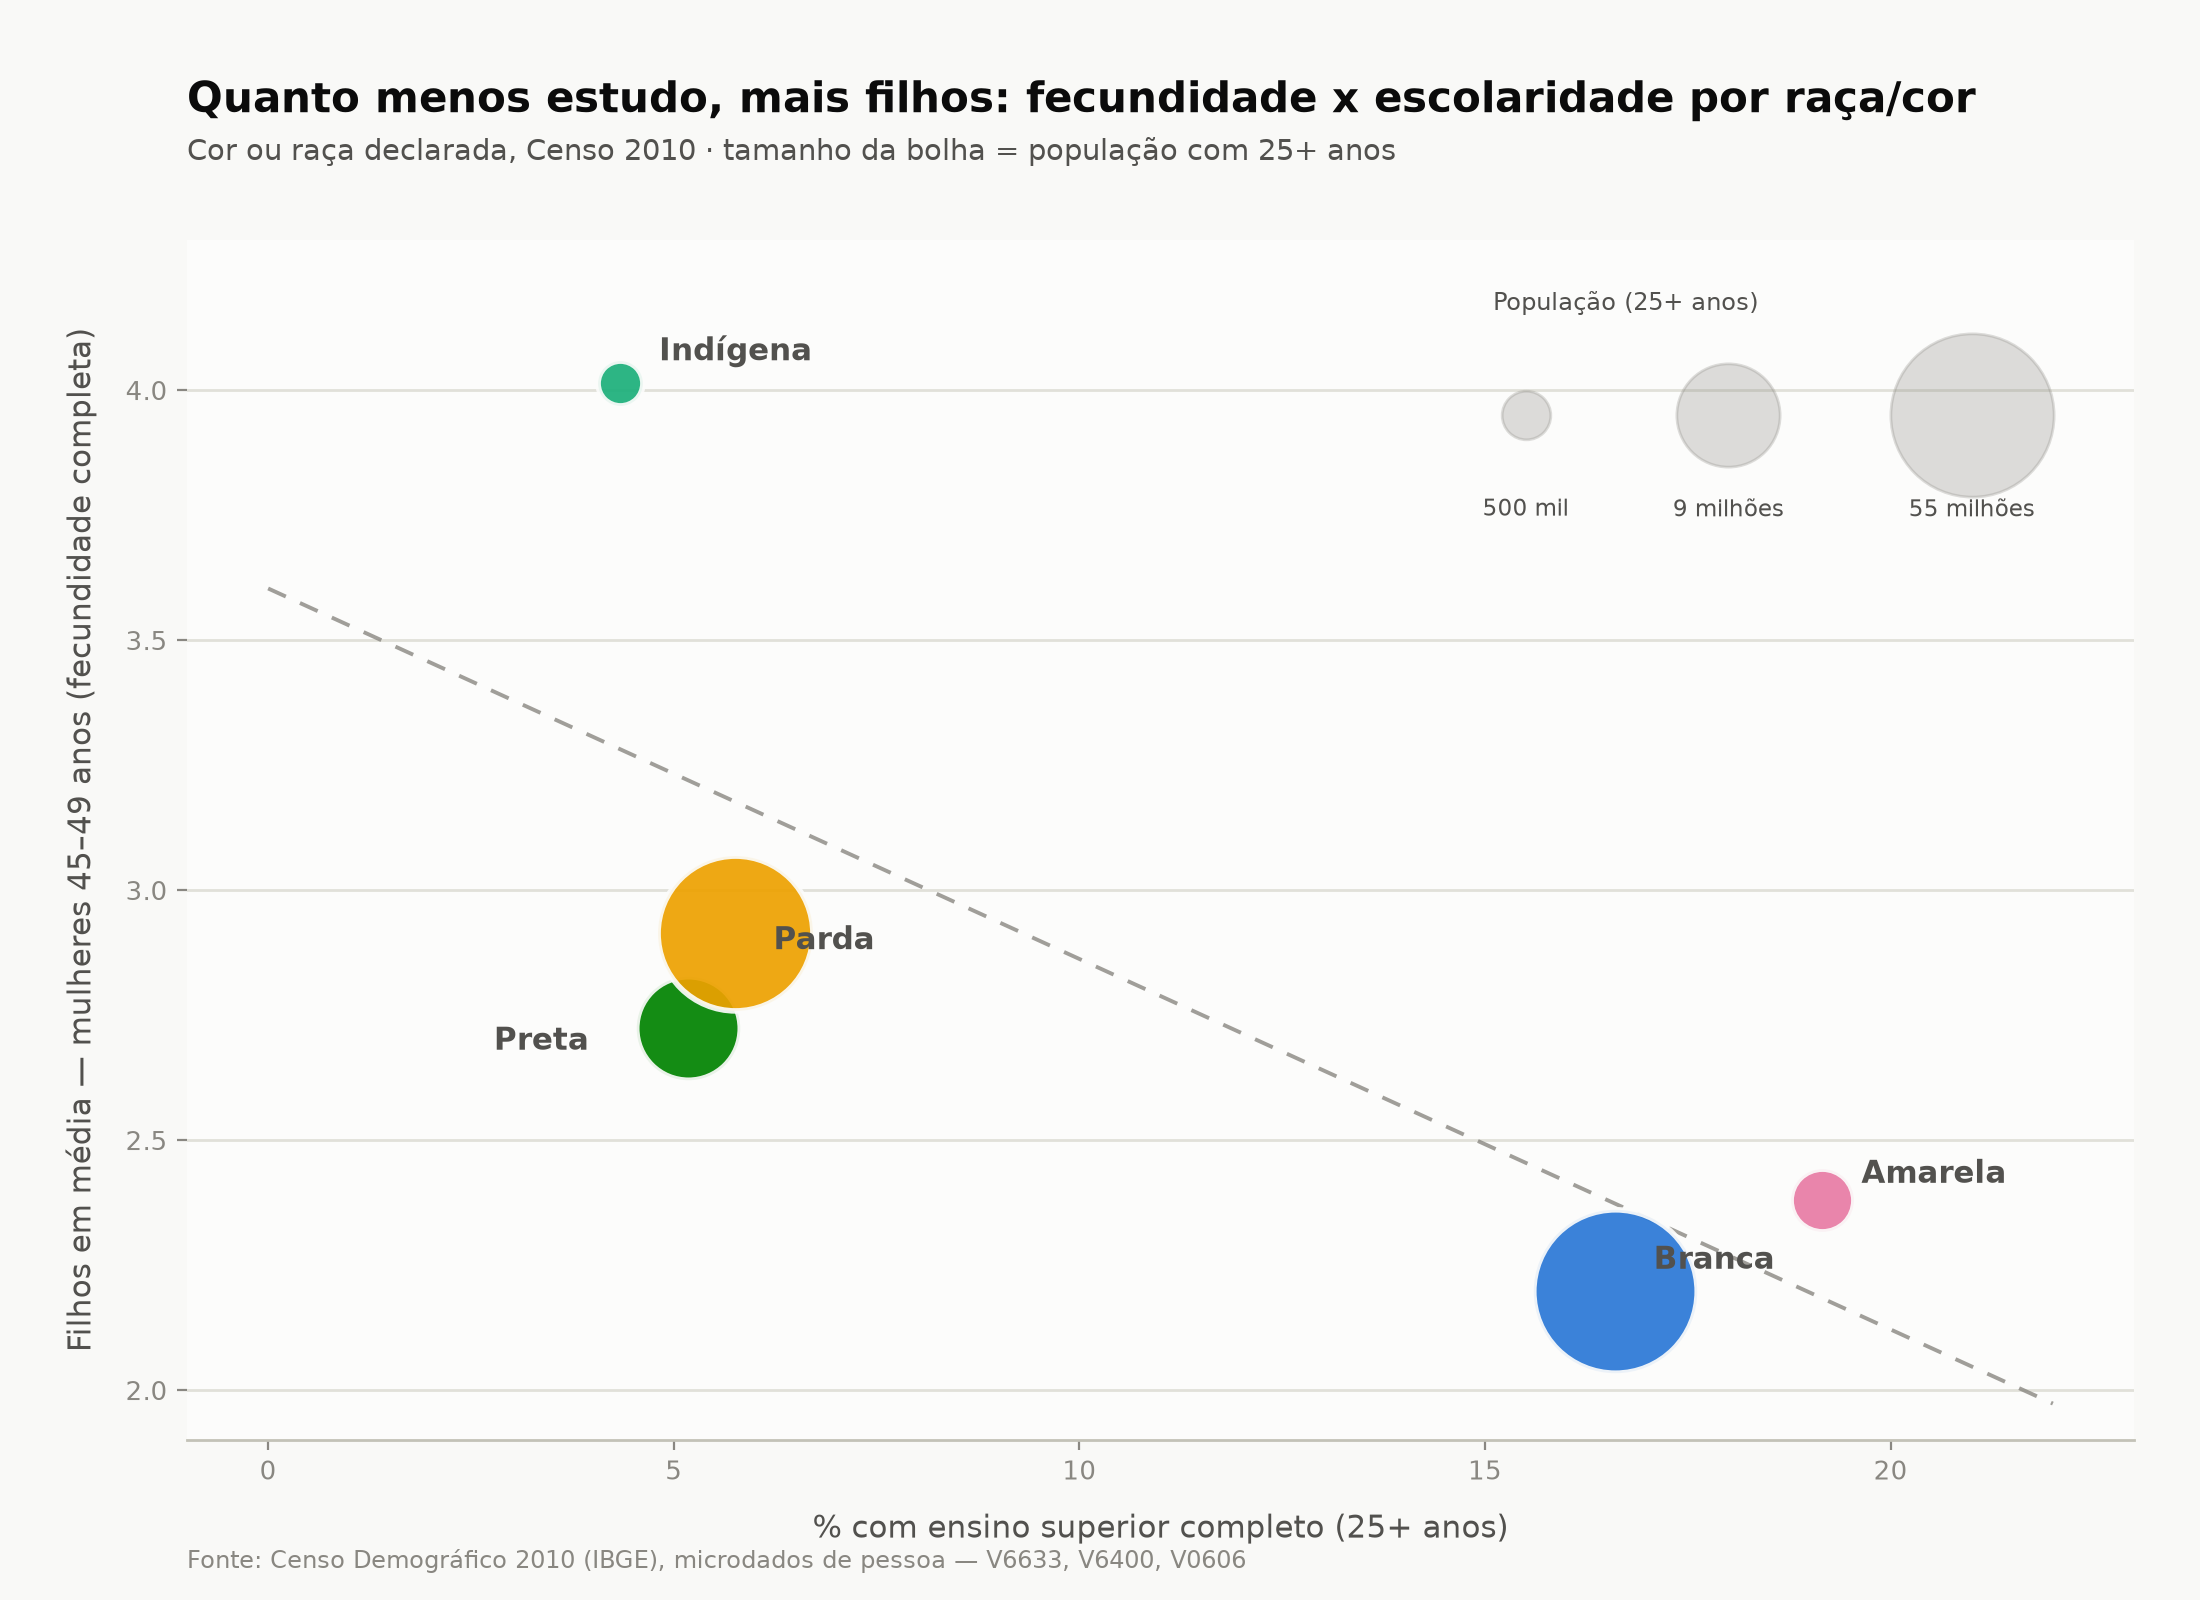
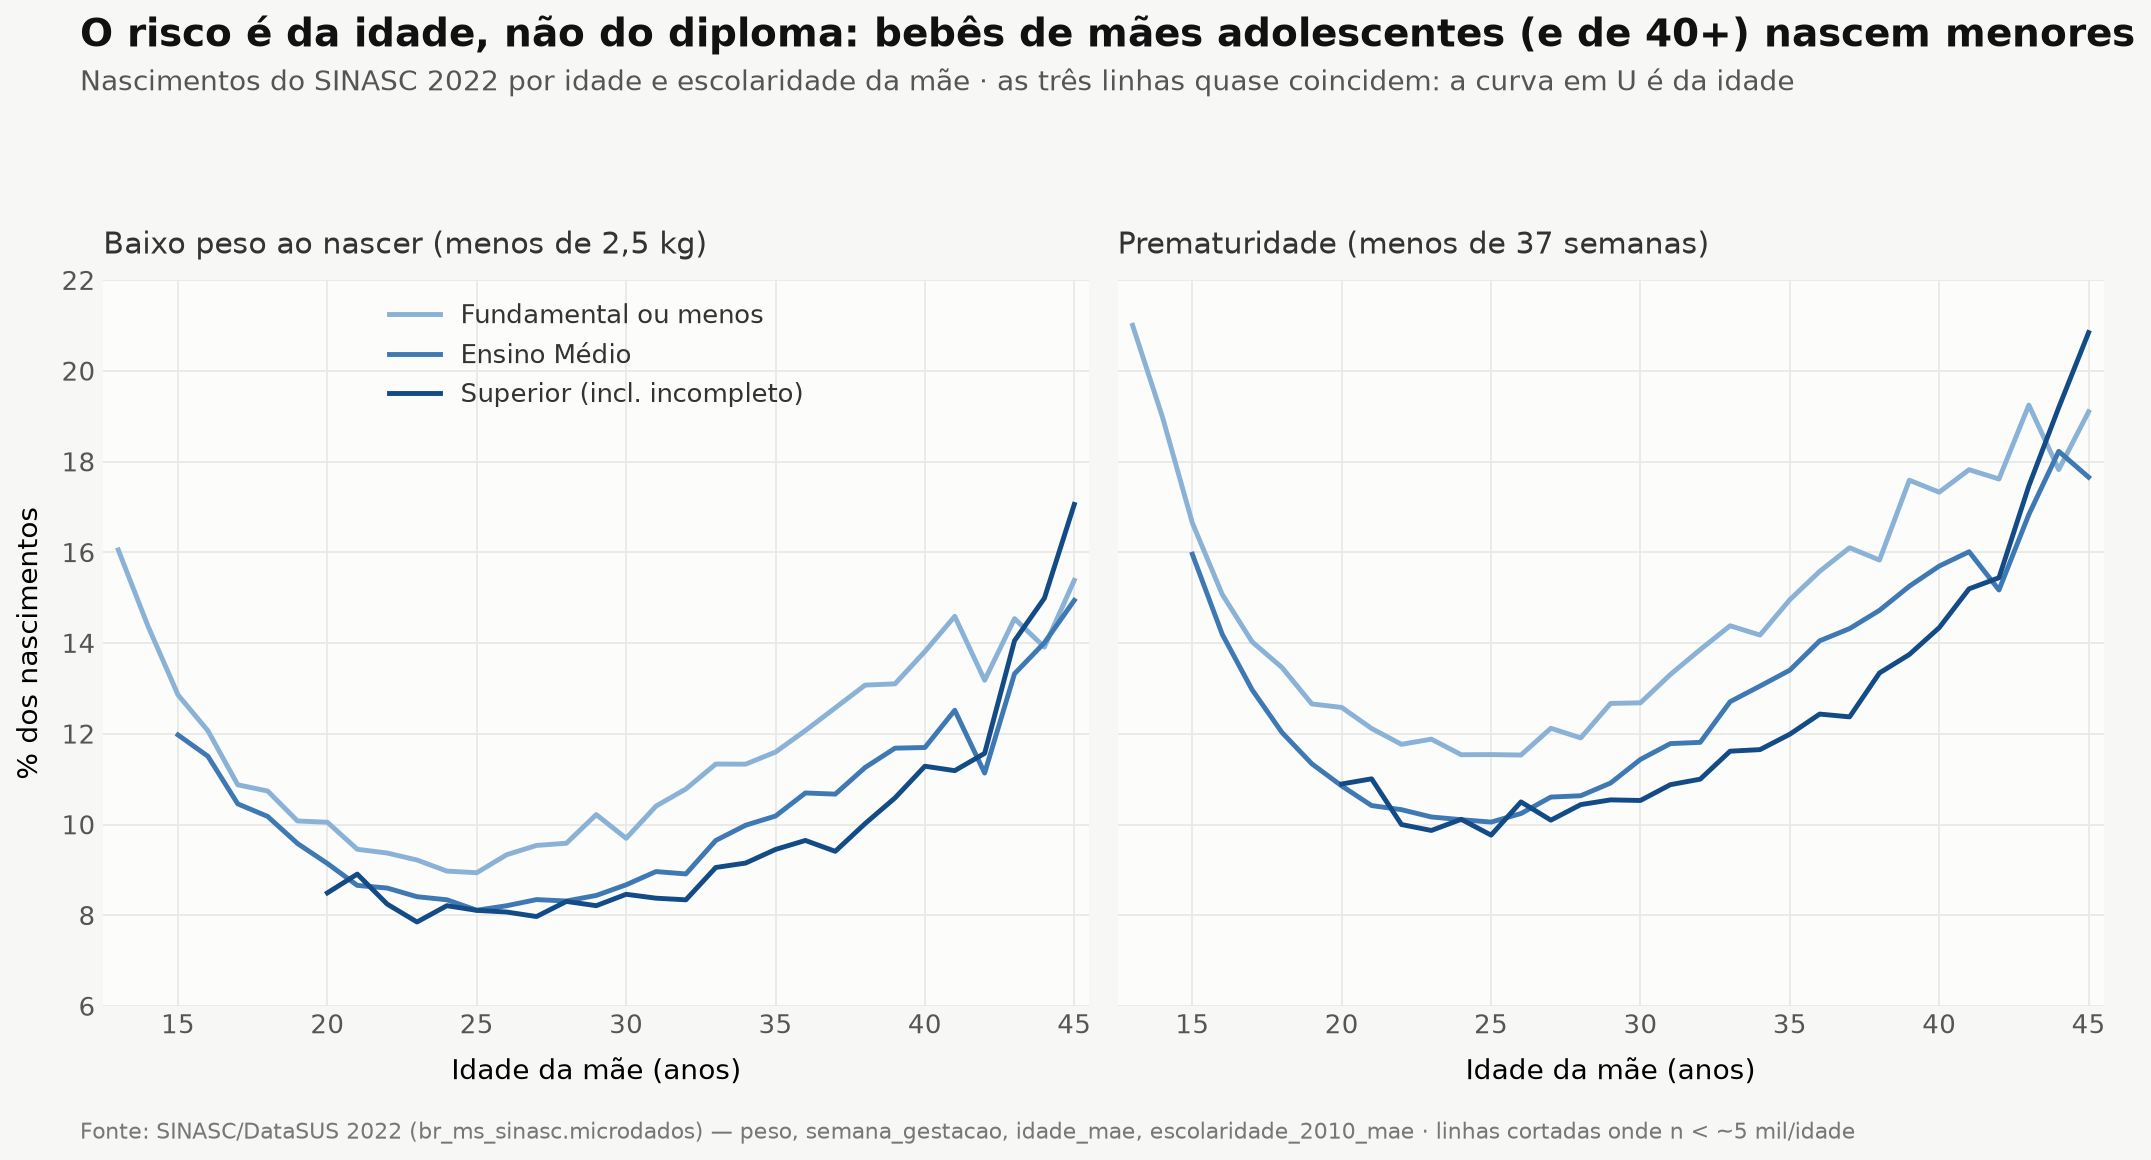
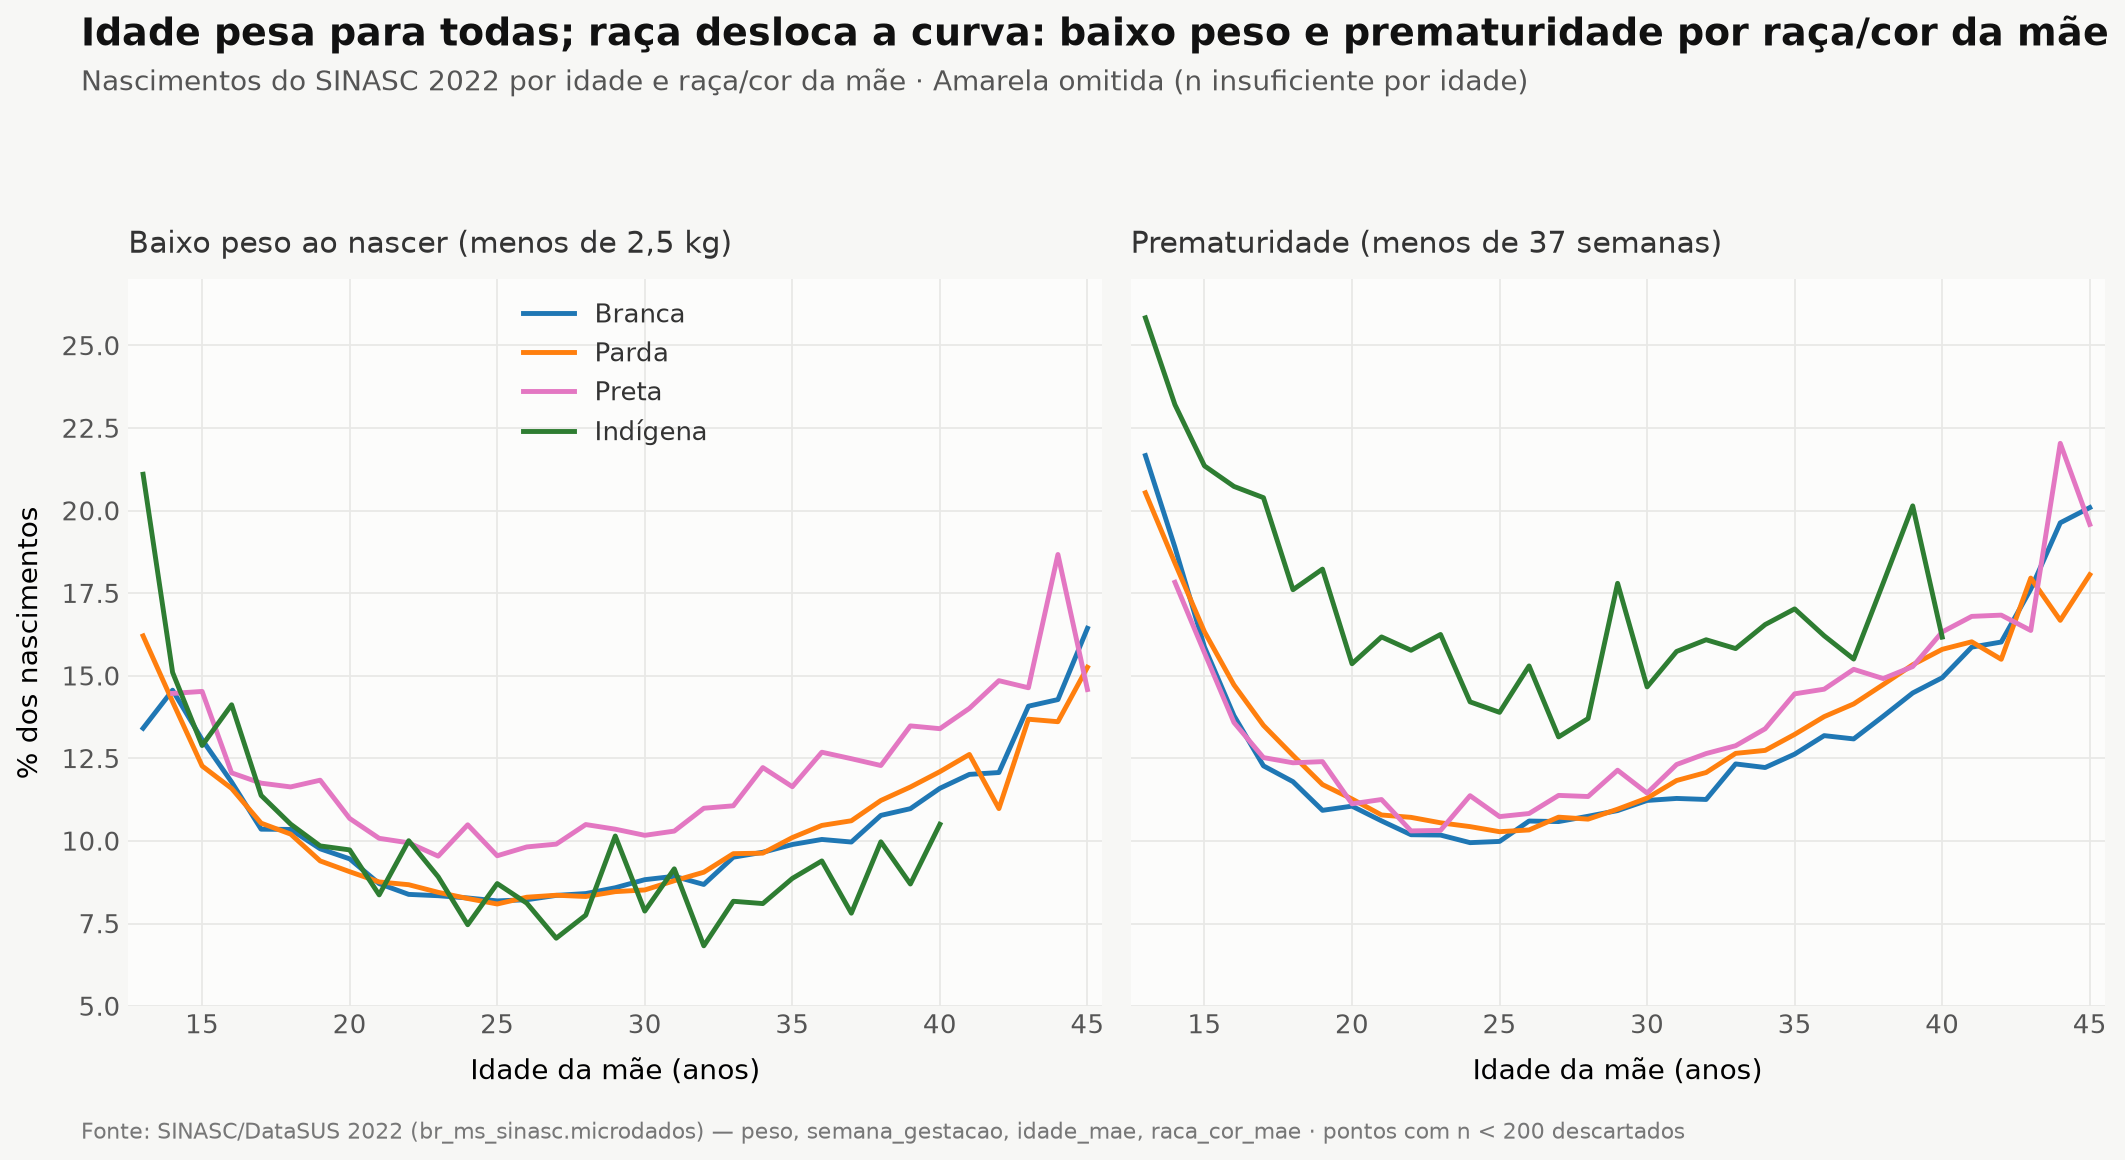
The IBGE Demographic Census and SINASC (the Live Birth Information System) record, for every birth in Brazil, the mother's age, race, education and religion — crossing these variables shows how they relate to fertility and to the newborn's health at birth.
The more schooling, the later the children
Fertility and education among Evangelicals
Fertility and education by race
The risk lies in age, not in the diploma
Race shifts the risk curve
04 · At what age each cancer kills
Brazil's Mortality Information System (SIM) records the underlying cause and the age of every death in the country. Isolating the 2022 deaths from malignant neoplasms and spreading each tumour across age bands, cancer stops being one disease and becomes thirty diseases running on different clocks.
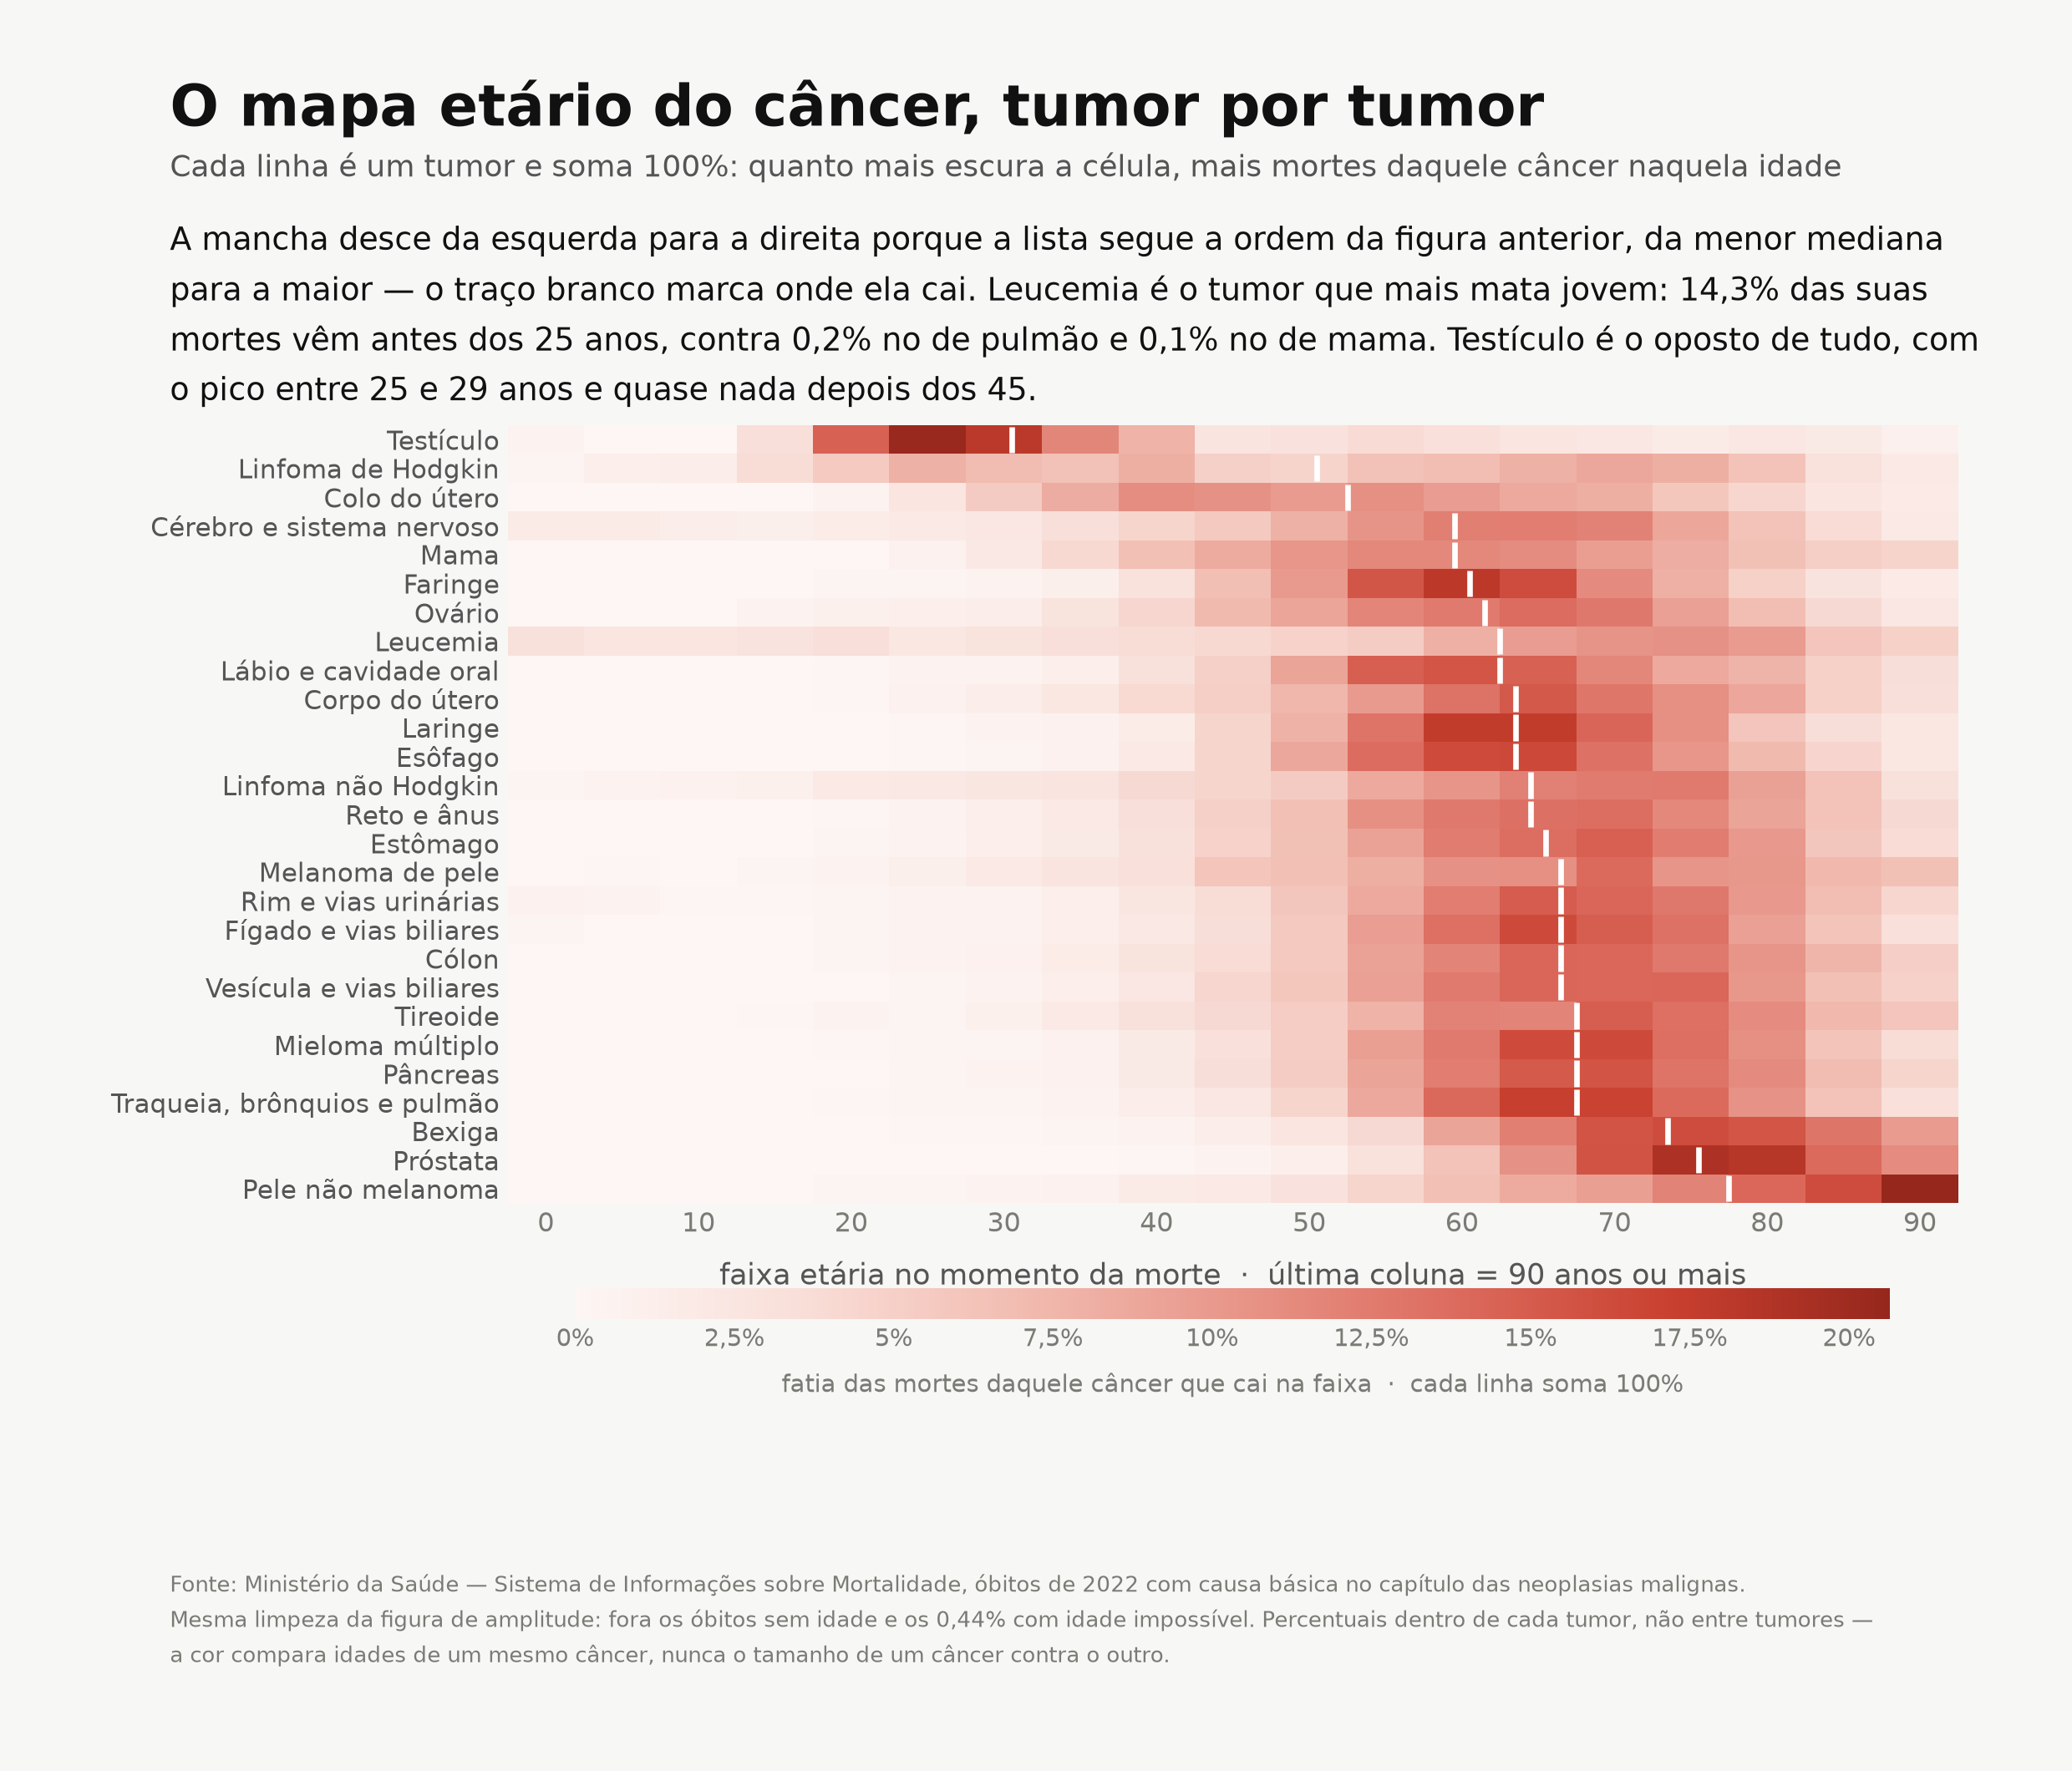
Testicular cancer kills at 33. Prostate cancer, at 78.
Read row by row, the chart sorts tumours by mechanism. A carcinoma is an accumulated copying accident: it takes decades of cell division and exposure, which is why lung, prostate, stomach and non-melanoma skin cancer barely register before 60. The exceptions are the ones that don't depend on that accumulation — leukaemia, the tumour that kills youngest, with 14.3% of its deaths before age 25 (against 0.2% for lung and 0.1% for breast cancer), central nervous system tumours, and testicular cancer, which arises from germ cells and vanishes from the map after 45. Cervical cancer runs on a clock of its own: it is timed by the ten-to-twenty-year gap between HPV infection and invasive disease.
Read the full analysis (in Portuguese) at rodado.xyz/analises/cancer-mata-interna.
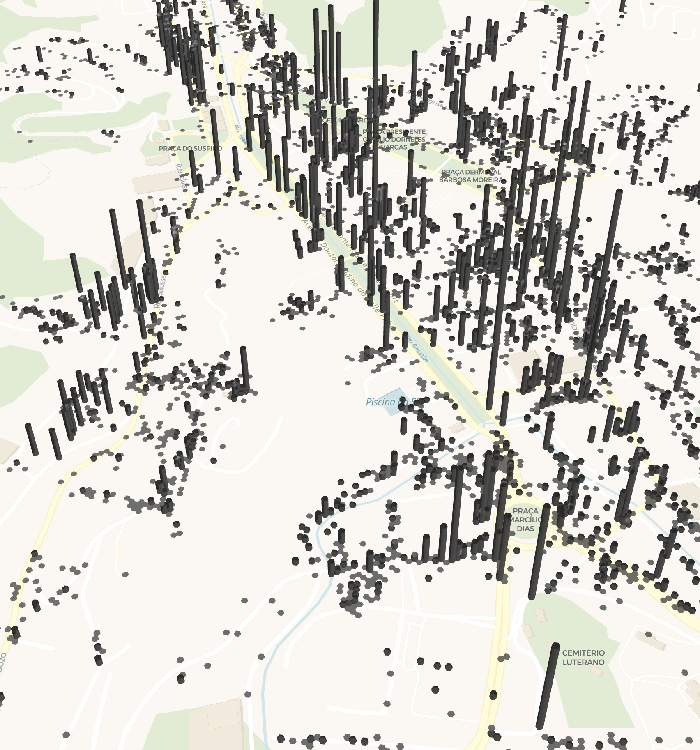
05 · Nova Friburgo in three dimensions
The National Registry of Addresses for Statistical Purposes (CNEFE) records every address visited by IBGE. Filtering down to the municipality of Nova Friburgo (RJ), the city can be reconstructed house by house — and each residence extruded by its number of residents.
Residences with height relative to the number of residents
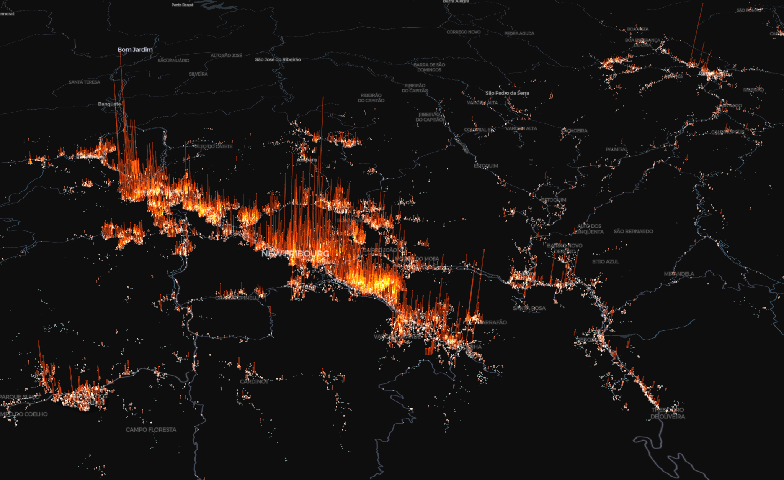
Explore the interactive version at ミ.xyz/dataviz/friba/pop_3d.
Every residence in the municipality
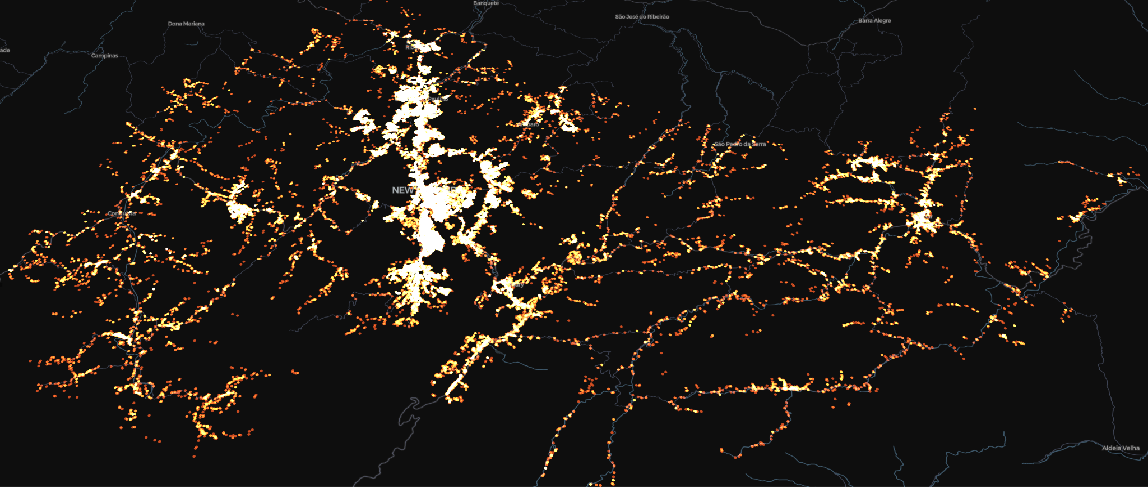
Where the city concentrates
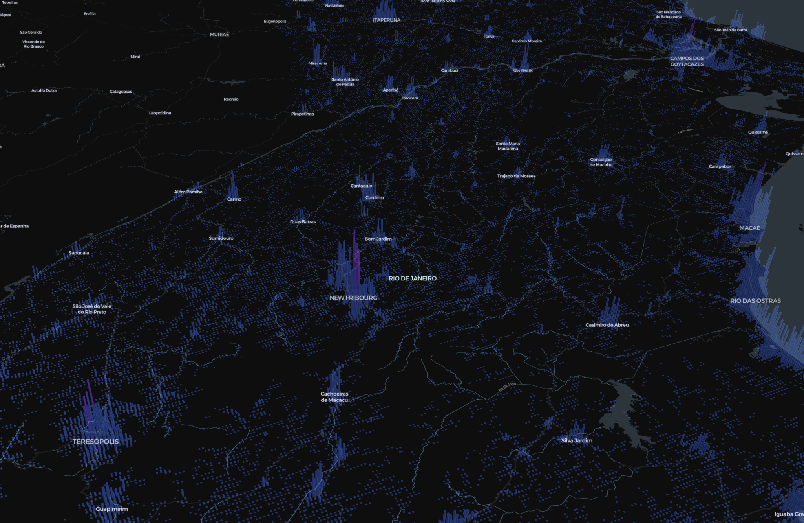
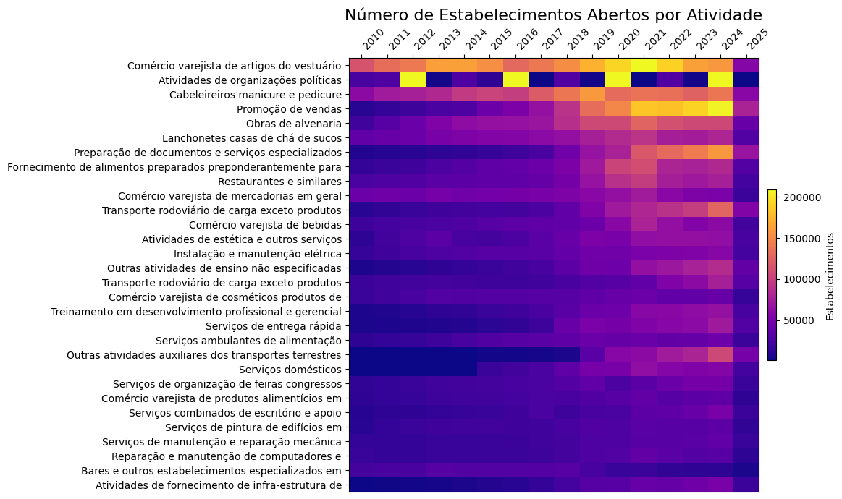
Where companies are born
06 · Garment factories and the pandemic
Every CNPJ registration carries the economic activity code (CNAE), the opening date and, when applicable, the closing date. Filtering the active garment factories of Nova Friburgo's lingerie hub, we can map the sector's geography — and watch, record by record, the impact of the pandemic.
The distribution of garment factories

Opened and closed during the pandemic
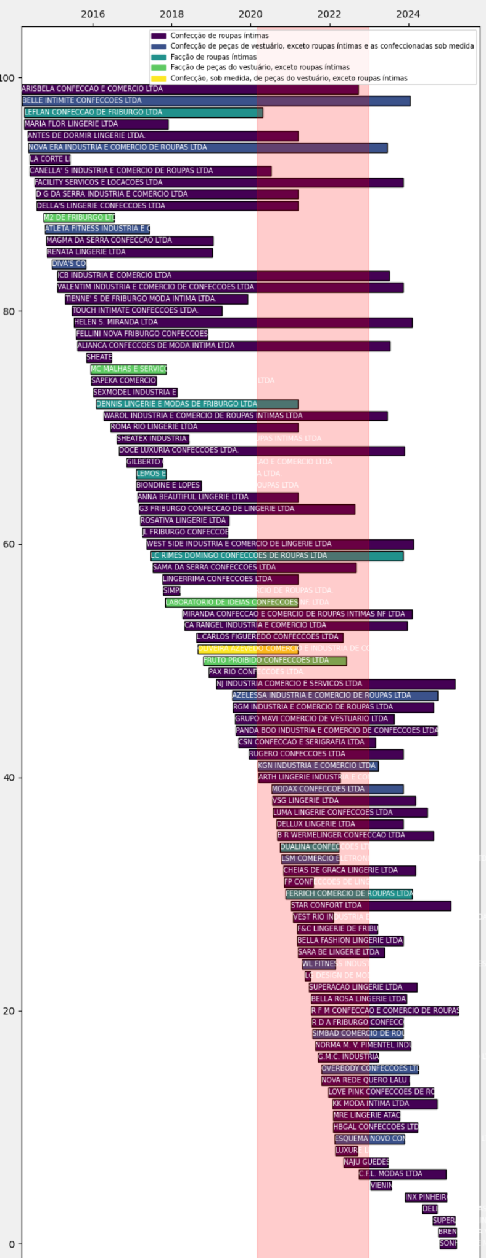
Which sectors closed after others?
Ordering company closures over time reveals a sequence: some economic sectors closed first, others held on longer — a temporal trace of the crisis moving through the local economy.

07 · Ownership networks
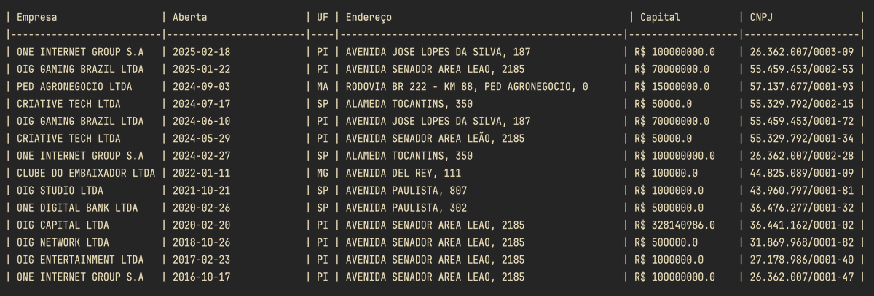
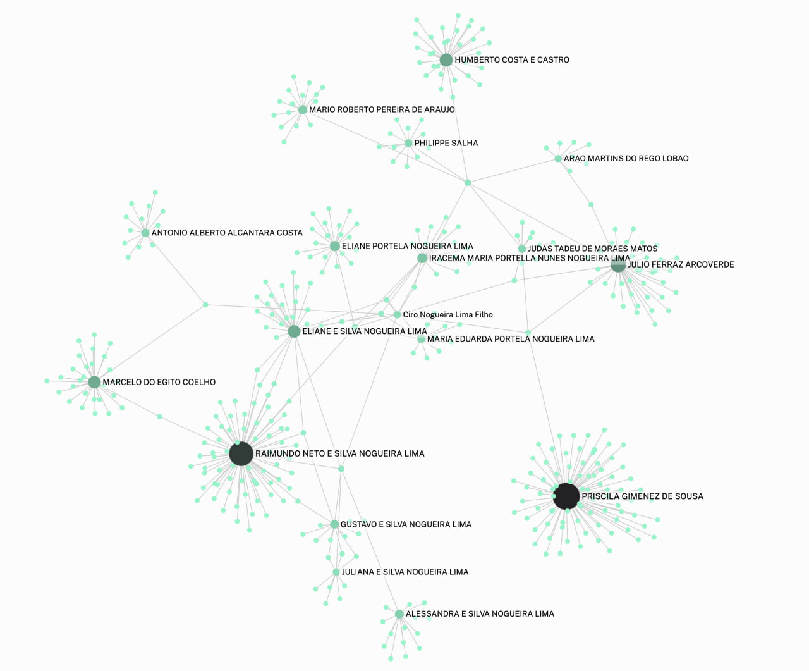
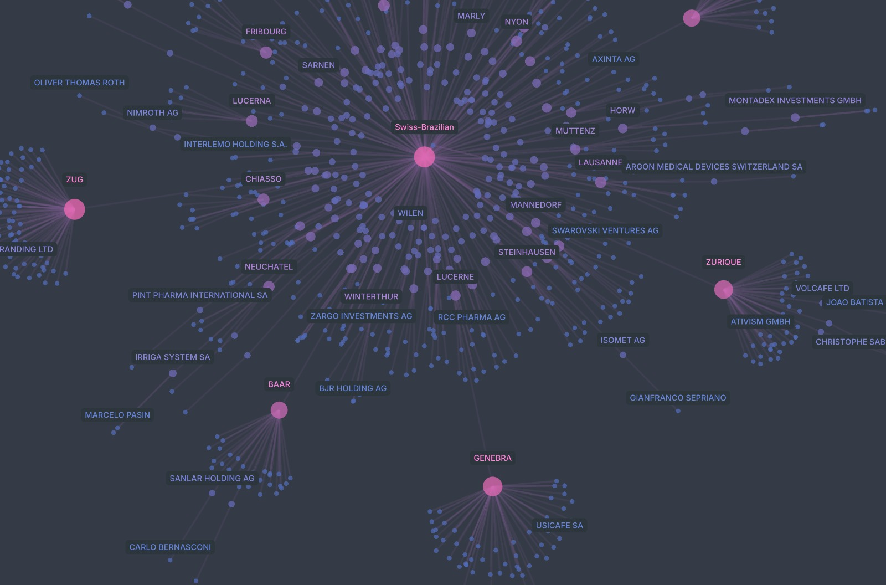
The CNPJ registry publishes the ownership structure of every company. Linking partners to companies — and companies to other partners — turns economic power relations into a navigable graph: who stands next to whom, and through what.
Nova Friburgo businesspeople with the most companies
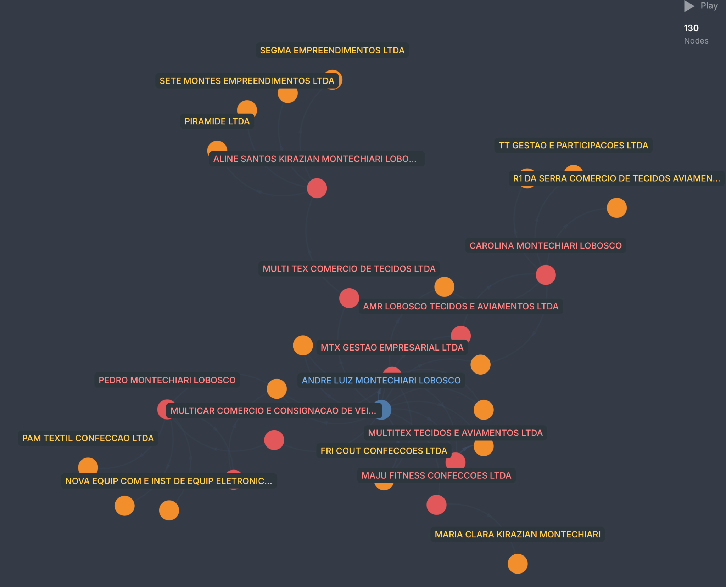
The companies of the "Tiger Game" owner
The business network of a senator
Swiss companies headquartered in Brazil
08 · Wage Atlas of Brazil
The Annual Report of Social Information (RAIS) records every formal employment contract in the country. Aggregating those contracts by municipality, the atlas shows where wages concentrate — and where formal employment nearly vanishes from the map.
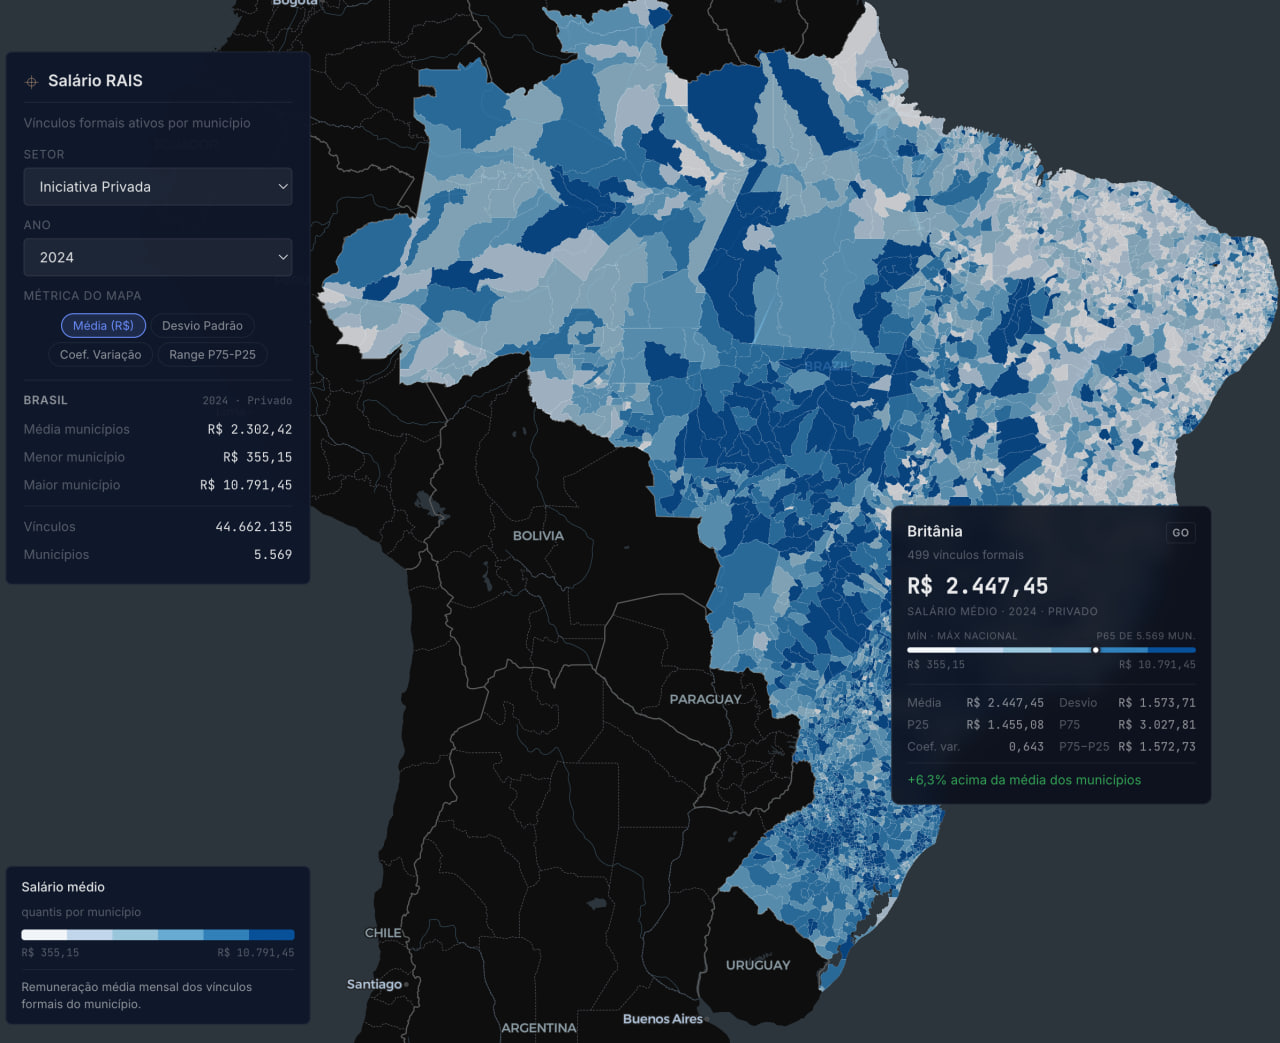
Explore the interactive atlas at ミ.xyz/dataviz/rais/mapa/.
09 · Housing censuses: 1970–2000
Each Sankey diagram reads an IBGE housing census in three layers: the household situation (rural, urban…), the occupancy condition (owned, rented, lent…) and the dwelling type. Following the flows across 1970, 1980 and 2000, the country's housing transformation appears all at once.
1970 Census
Housing patterns before mass urbanization: rural owned households still rival urban ones, and the predominant construction type is rustic.
---
config:
  sankey:
    showValues: false
    useMaxWidth: true
---
sankey-beta
"Urban","No declaration",1168
"Suburban","No declaration",26
"Rural","No declaration",775
"Urban","Owned (paid off)",6602220
"Suburban","Owned (paid off)",345236
"Rural","Owned (paid off)",6514120
"Urban","Owned (being acquired)",1021044
"Suburban","Owned (being acquired)",33202
"Rural","Owned (being acquired)",111461
"Urban","Rented",3575026
"Suburban","Rented",109313
"Rural","Rented",300507
"Unclassified (situation)","Rented",2
"Urban","Lent",906408
"Suburban","Lent",40742
"Rural","Lent",920018
"Urban","Other condition",139868
"Suburban","Other condition",13135
"Rural","Other condition",2859867
"Urban","Unclassified (condition)",16
"No declaration","Rustic",1434
"No declaration","Durable",535
"Owned (paid off)","Rustic",9912955
"Owned (paid off)","Durable",3548621
"Owned (being acquired)","Rustic",1032172
"Owned (being acquired)","Durable",133535
"Rented","Rustic",3465003
"Rented","Durable",519845
"Lent","Rustic",1235874
"Lent","Durable",631294
"Other condition","Rustic",1659069
"Other condition","Durable",1353801
"Unclassified (condition)","Rustic",16
Source: IBGE, 1970 Demographic Census — household situation → occupancy condition → construction type.
1980 Census
The great urbanization begins: cities and towns already concentrate most households, and apartment living starts to register in the statistics.
---
config:
  sankey:
    showValues: false
    useMaxWidth: true
---
sankey-beta
"Rural settlement","Rented",19572
"Rural settlement","Lent by employer",13165
"Rural settlement","Lent by individual",8836
"Rural settlement","Unknown",437
"Rural settlement","Other condition",3330
"Rural settlement","Owned (being acquired)",11155
"Rural settlement","Owned (paid off)",124728
"Isolated urban area","Rented",6098
"Isolated urban area","Lent by employer",1893
"Isolated urban area","Lent by individual",1910
"Isolated urban area","Unknown",38
"Isolated urban area","Other condition",342
"Isolated urban area","Owned (being acquired)",1212
"Isolated urban area","Owned (paid off)",15536
"City or town","Rented",1343492
"City or town","Lent by employer",96021
"City or town","Lent by individual",277264
"City or town","Unknown",6427
"City or town","Other condition",54910
"City or town","Owned (being acquired)",344477
"City or town","Owned (paid off)",2334531
"Rural zone","Rented",34671
"Rural zone","Lent by employer",429076
"Rural zone","Lent by individual",170478
"Rural zone","Unknown",3637
"Rural zone","Other condition",46914
"Rural zone","Owned (being acquired)",8230
"Rural zone","Owned (paid off)",1125161
"Rented","Apartment",192360
"Rented","House",1211473
"Lent by employer","Apartment",15897
"Lent by employer","House",524258
"Lent by individual","Apartment",15198
"Lent by individual","House",443290
"Unknown","Apartment",1420
"Unknown","House",9119
"Other condition","Apartment",3131
"Other condition","House",102365
"Owned (being acquired)","Apartment",107008
"Owned (being acquired)","House",258066
"Owned (paid off)","Apartment",115652
"Owned (paid off)","House",3484304
Source: IBGE, 1980 Demographic Census — household situation → occupancy condition → dwelling type.
2000 Census
The millennium turn: a simplified urban/rural classification, the consolidation of urban living and of fully-owned homes — with the apartment as an established category.
---
config:
  sankey:
    showValues: false
    useMaxWidth: true
---
sankey-beta
"Rural","Rented",67876
"Rural","Lent in another way",334512
"Rural","Lent by employer",776836
"Rural","Unknown",70761
"Rural","Other condition",68061
"Rural","Owned (being acquired)",78000
"Rural","Owned (paid off)",3476050
"Urban","Rented",2206025
"Urban","Lent in another way",855342
"Urban","Lent by employer",207996
"Urban","Unknown",108024
"Urban","Other condition",170945
"Urban","Owned (being acquired)",1146742
"Urban","Owned (paid off)",10707242
"Rented","Apartment",315423
"Rented","House",1907731
"Rented","Single room",50747
"Lent in another way","Apartment",35972
"Lent in another way","House",1124609
"Lent in another way","Single room",29273
"Lent by employer","Apartment",21095
"Lent by employer","House",956863
"Lent by employer","Single room",6874
"Unknown","Other",178785
"Other condition","Apartment",8251
"Other condition","House",222231
"Other condition","Single room",8524
"Owned (being acquired)","Apartment",287630
"Owned (being acquired)","House",933642
"Owned (being acquired)","Single room",3470
"Owned (paid off)","Apartment",604698
"Owned (paid off)","House",13508004
"Owned (paid off)","Single room",70590
Source: IBGE, 2000 Demographic Census — household situation → occupancy condition → dwelling type.
What the three censuses show
- Accelerating urbanization: in 1970, rural households still rivaled urban ones; by 2000, urban areas concentrate roughly three times more households than rural ones.
- Consolidation of home ownership: the fully-owned home is the dominant condition in all three censuses — and widens its lead over renting.
- Access to credit: the "owned, being acquired" category grows markedly between 1970 and 2000, reflecting the expansion of housing finance.
- The apartment era: nearly invisible in 1970, the apartment appears in 1980 and settles in as a relevant category by 2000.
🔗 Source repository: IBGE housing census analysis
About the data
We experiment with visualizing public data, integrating the IBGE Censuses, the CNEFE address registry and the Federal Revenue's company registry: population data by religious profile, education, race and age; companies with economic activities, ownership structures, religious organizations, police battalions, city halls, quilombola communities and banks — most of them geolocated — potentially cross-referenced with the Electoral Court (TSE), Chamber of Deputies expenses, parliamentary caucuses and "PIX" budget amendments.
Digital cartography makes it possible to spatialize complex knowledge — such as economic patterns, religious practices, or networks of power — that used to remain scattered or hidden in raw data. This spatialization turns large volumes of data into accessible cognitive interfaces, mobilizing both visual perception and critical analysis. (Drucker, 2011)